Sept. 9, 2025

Kelowna Real Estate Market Update – August 2025 | Central Okanagan Report

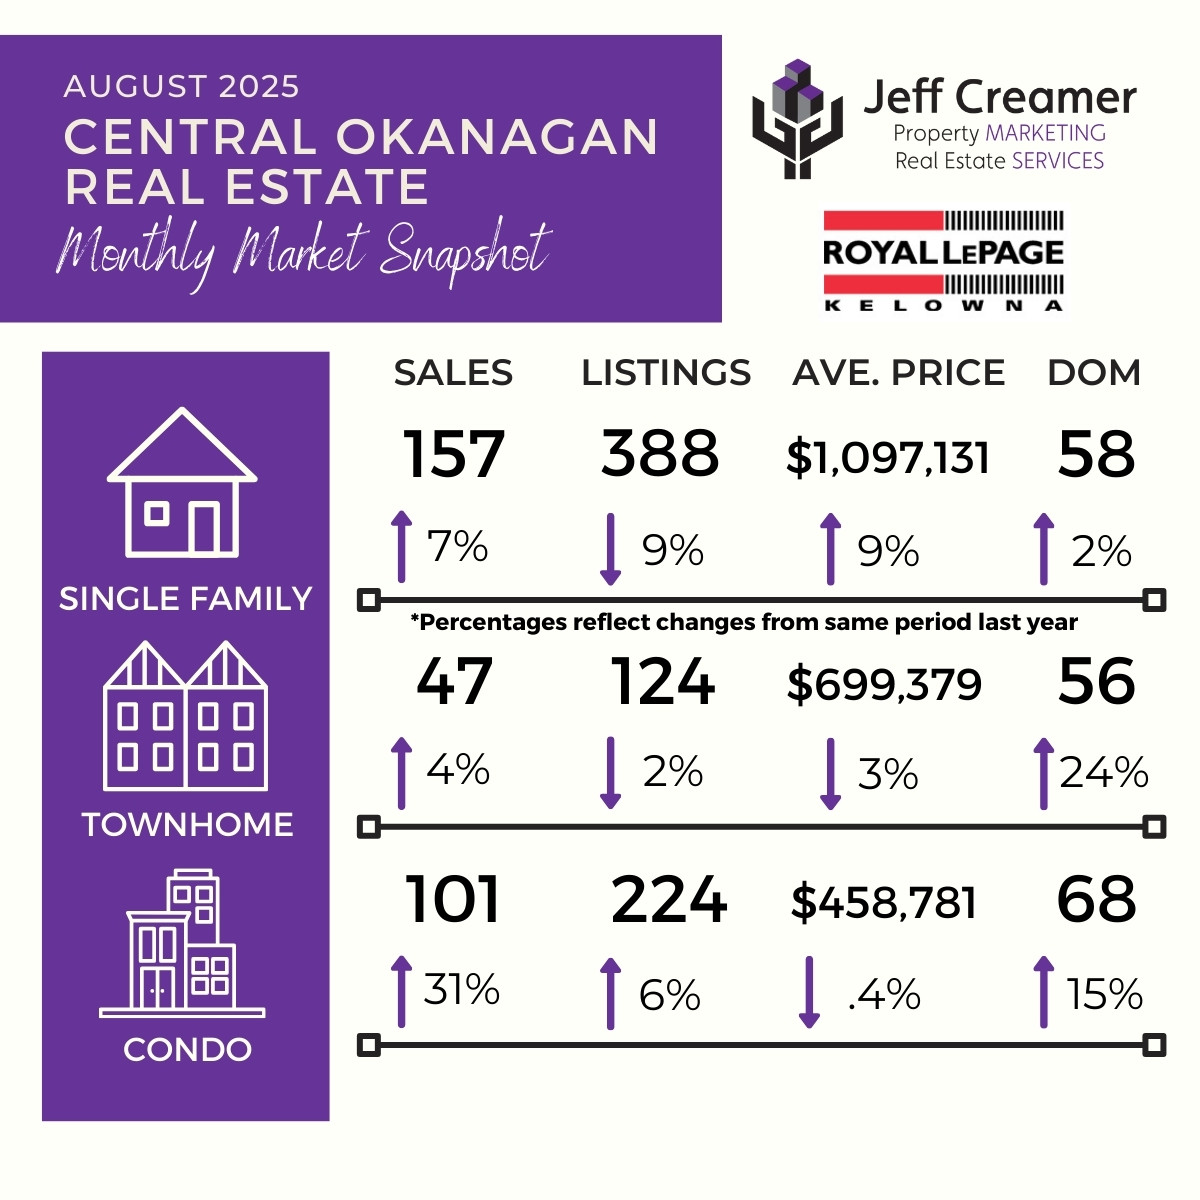
Central Okanagan / Kelowna Real Estate Market Statistics Snapshot: August 2025

August 2025 Kelowna Housing Market Trends and Statistics

Here's a look at how the real estate market performed across Kelowna and the Central Okanagan in August 2025. This monthly snapshot highlights key data for single-family homes, townhomes, and condos—including pricing trends, sales activity, new listings, and average days on market.

Kelowna Single-Family Homes – August 2025

  • Sales: There were 157 single-family home sales recorded in August 2025, marking a 7% increase from the 147 sales in August 2024.
  • New Listings: A 9% decline was noted in new listings, with 388 homes entering the market, down from 425 the same time last year.
  • Average Price: The average sale price for a single-family home climbed 9% to $1,097,131, compared to $1,006,399 in August 2024.
  • Days on Market: Properties took slightly longer to sell this year, with an average of 58 days, a 2% increase from 57 days a year ago.

Kelowna Townhomes – August 2025

  • Sales: Townhome sales increased slightly by 4%, with 47 units sold this August versus 45 in August 2024.
  • New Listings: There were 124 new townhome listings in August 2025, a 2% drop from 126 the year before.
  • Average Price: The average townhome price decreased 3%, reaching $699,379, down from $717,399 in August 2024.
  • Days on Market: Townhomes also saw longer selling times, averaging 56 days on the market—24% slower than the 45-day average last August.

Kelowna Condos – August 2025

  • Sales: Condo sales increased by 31%, with 101 units sold compared to 77 in August 2024.
  • New Listings: Condo inventory grew by 6%, rising to 224 listings in August 2025, up from 212 during the same month last year.
  • Average Price: Condo prices saw a slight .4% decrease, with the average now at $458,781, down from $460,565 in August 2024.
  • Days on Market: Condos were on the market longer this August—68 days on average, which is a 15% increase from 59 days last year.

Need Help with Buying or Selling in Kelowna?

Whether you're planning to list your property or find a new home in Kelowna, connect with Jeff Creamer at Royal LePage Kelowna for expert advice and local market knowledge.

  • Call: 250-575-7112
  • Email: jeff@shopkelownahomes.com

View July 2025 Central Okanagan / Kelowna Real Estate Market Statistics

Source: Association of Interior Realtors
Posted in Market Reports
Aug. 5, 2025

Central Okanagan / Kelowna Real Estate Market Statistics: July 2025

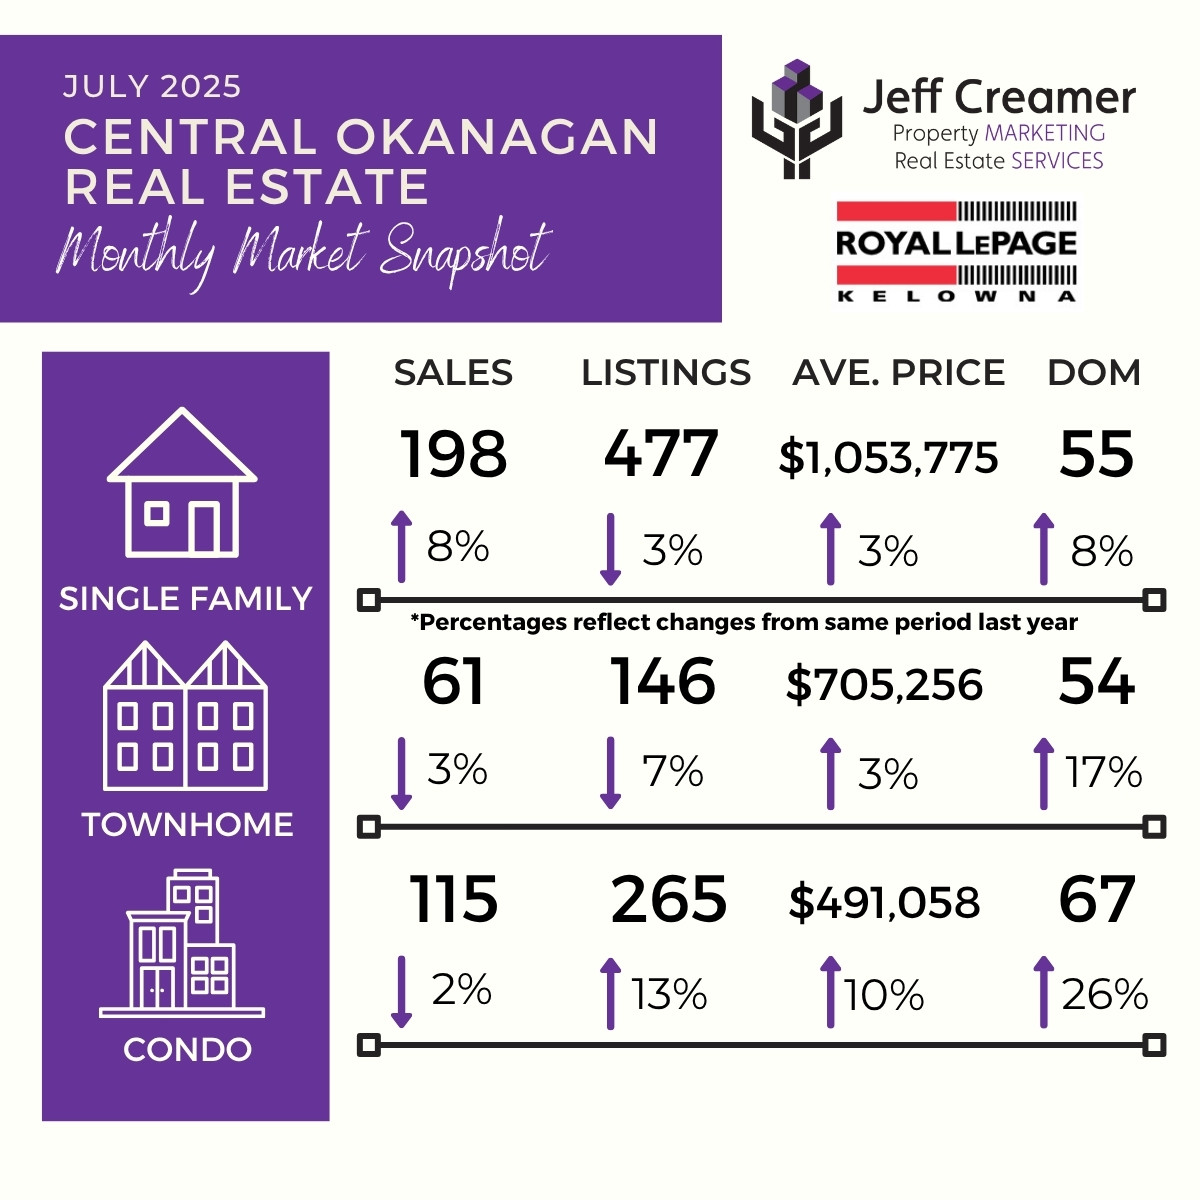
Central Okanagan / Kelowna Real Estate Market Statistics Snapshot: July 2025Kelowna & Central Okanagan Real Estate Market Update – July 2025

Here’s a look at how the real estate market performed across Kelowna and the Central Okanagan in July 2025. This monthly snapshot highlights key data for single-family homes, townhomes, and condos—including pricing trends, sales activity, new listings, and average days on market.

Kelowna Single-Family Homes – July 2025

  • Sales: There were 198 single-family home sales recorded in July 2025, marking an 8% increase from the 183 sales in July 2024.
  • New Listings: A 3% decline was noted in new listings, with 477 homes entering the market, down from 492 the same time last year.
  • Average Price: The average sale price for a single-family home climbed 3% to $1,053,775, compared to $1,026,584 in July 2024.
  • Days on Market: Properties took longer to sell this year, with an average of 55 days, an 8% increase from 51 days a year ago.

Kelowna Townhomes – July 2025

  • Sales: Townhome sales dipped by 3%, with 61 units sold this July versus 63 in July 2024.
  • New Listings: There were 146 new townhome listings in July 2025, which is a 7% drop from 157 the year before.
  • Average Price: The average townhome price rose 3%, reaching $705,256, up from $685,000 in July 2024.
  • Days on Market: Townhomes also saw longer selling times, averaging 54 days on the market—17% slower than the 46-day average last July.

Kelowna Condos – July 2025

  • Sales: Condo sales experienced a 2% decline, with 115 units sold compared to 117 in July 2024.
  • New Listings: Condo inventory grew by 13%, rising to 265 listings in July 2025, up from 235 during the same month last year.
  • Average Price: Condo prices saw a 10% increase, with the average now at $491,058, up from $476,224 in July 2024.
  • Days on Market: Condos were on the market significantly longer this July—67 days on average, which is a 26% increase from 53 days last year.

Need Help with Buying or Selling in Kelowna?

Whether you’re planning to list your property or find a new home in Kelowna, connect with Jeff Creamer at Royal LePage Kelowna for expert advice and local market knowledge.

  • Call: 250-575-7112
  • Email: jeff@shopkelownahomes.com

View June 2025 Central Okanagan / Kelowna Real Estate Market Statistics

Source: Association of Interior Realtors
Posted in Market Reports
July 7, 2025

Central Okanagan / Kelowna Real Estate Market Statistics: June 2025

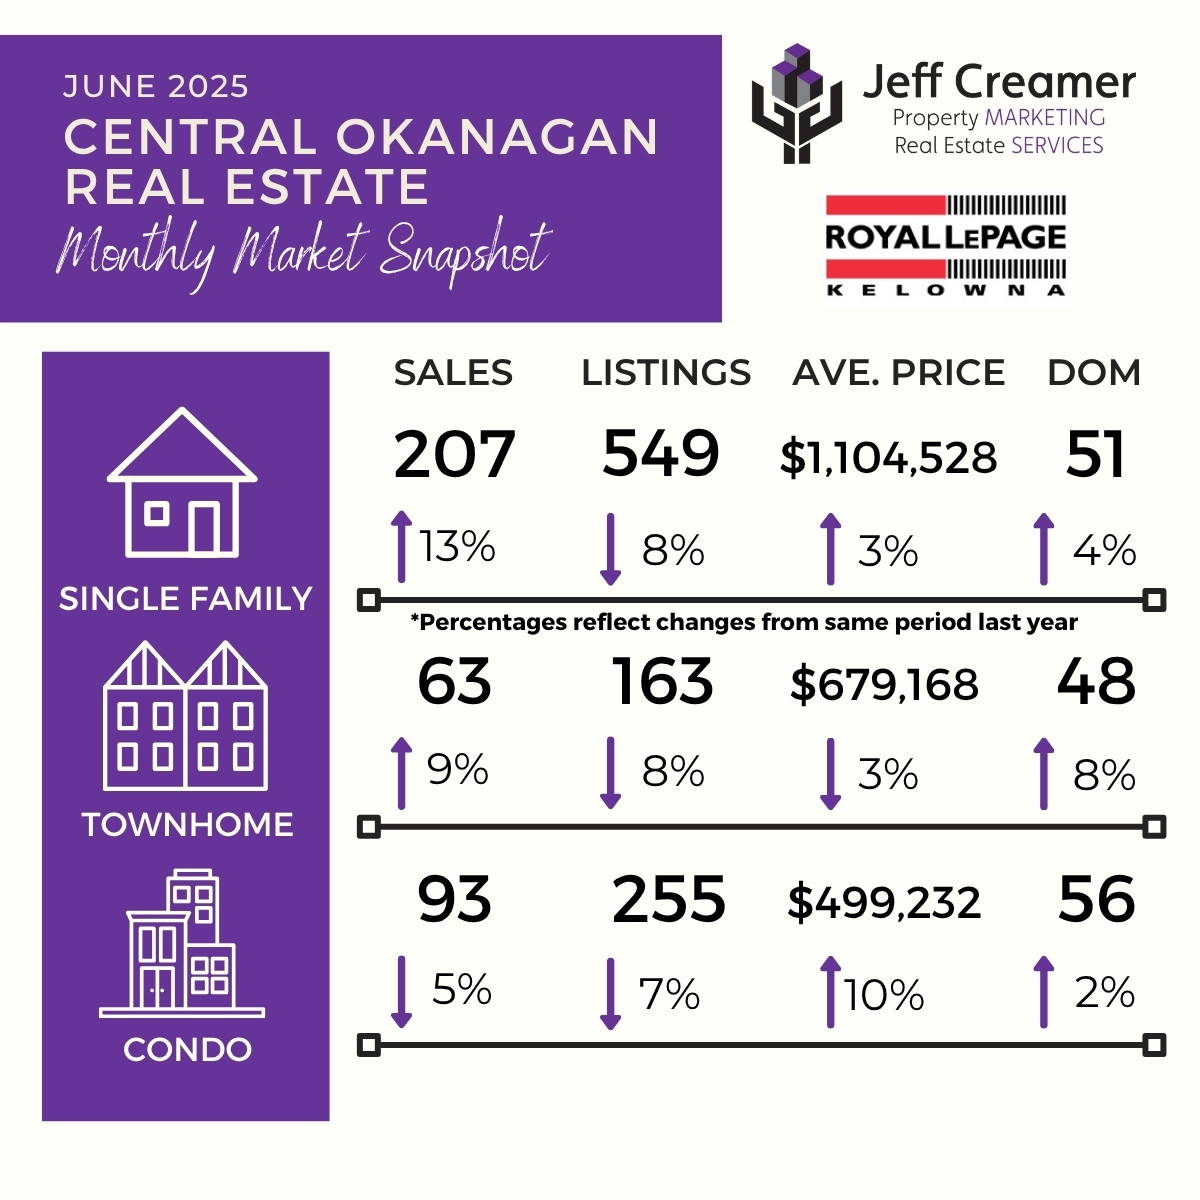
Central Okanagan / Kelowna Real Estate Market Statistics Snapshot: June 2025Central Okanagan / Kelowna Real Estate Market Report – June 2025

Stay up to date with the latest real estate trends in Kelowna and the Central Okanagan. This June 2025 market update covers key stats and insights for single-family homes, townhouses, and condos—including home sales, listing inventory, average prices, and days on market.

Kelowna Single-Family Home Stats – June 2025

  • Sales: Single-family home sales rose 13% year-over-year, with 207 homes sold in June 2025 compared to 183 in June 2024.
  • New Listings: Listings dropped 8%, with 549 new homes hitting the market in June 2025, down from 597 in June 2024.
  • Average Price: The average price for a single-family home increased by 3% to $1,104,528, up from $1,074,585 in June 2024.
  • Days on Market: Homes took slightly longer to sell, averaging 51 days on the market—4% slower than June 2024’s average of 49 days.

Kelowna Townhome Market Overview – June 2025

  • Sales: Townhome sales climbed 9%, with 63 units sold this June compared to 58 in June 2024.
  • New Listings: Inventory fell by 8%, with 163 new listings in June 2025 versus 178 the year prior.
  • Average Price: The average townhome price dropped by 3%, coming in at $679,168, down from $700,205 in June 2024.
  • Days on Market: Townhouses took longer to sell this year, averaging 48 days on the market—up 8% from 44 days in June 2024.

Kelowna Condo Market Snapshot – June 2025

  • Sales: Condo sales declined by 5%, with 93 units sold in June 2025 compared to 98 in June 2024.
  • New Listings: The number of new condo listings fell 7%, down to 255 in June 2025 from 273 the previous June.
  • Average Price: Condo prices rose 10%, reaching $499,232 in June 2025—up from $452,513 in June 2024.
  • Days on Market: Condos took 2% longer to sell this year, averaging 56 days on the market compared to 55 days last June.

Buying or Selling Real Estate in Kelowna?

If you're planning to buy or sell a home in the Kelowna area, connect with Jeff Creamer at Royal LePage Kelowna for expert guidance on the Central Okanagan real estate market.

  • Call: 250-575-7112
  • Email: jeff@shopkelownahomes.com

View May 2025 Central Okanagan / Kelowna Real Estate Market Statistics

Source: Association of Interior Realtors
Posted in Market Reports
June 3, 2025

Central Okanagan / Kelowna Real Estate Market Statistics: May 2025

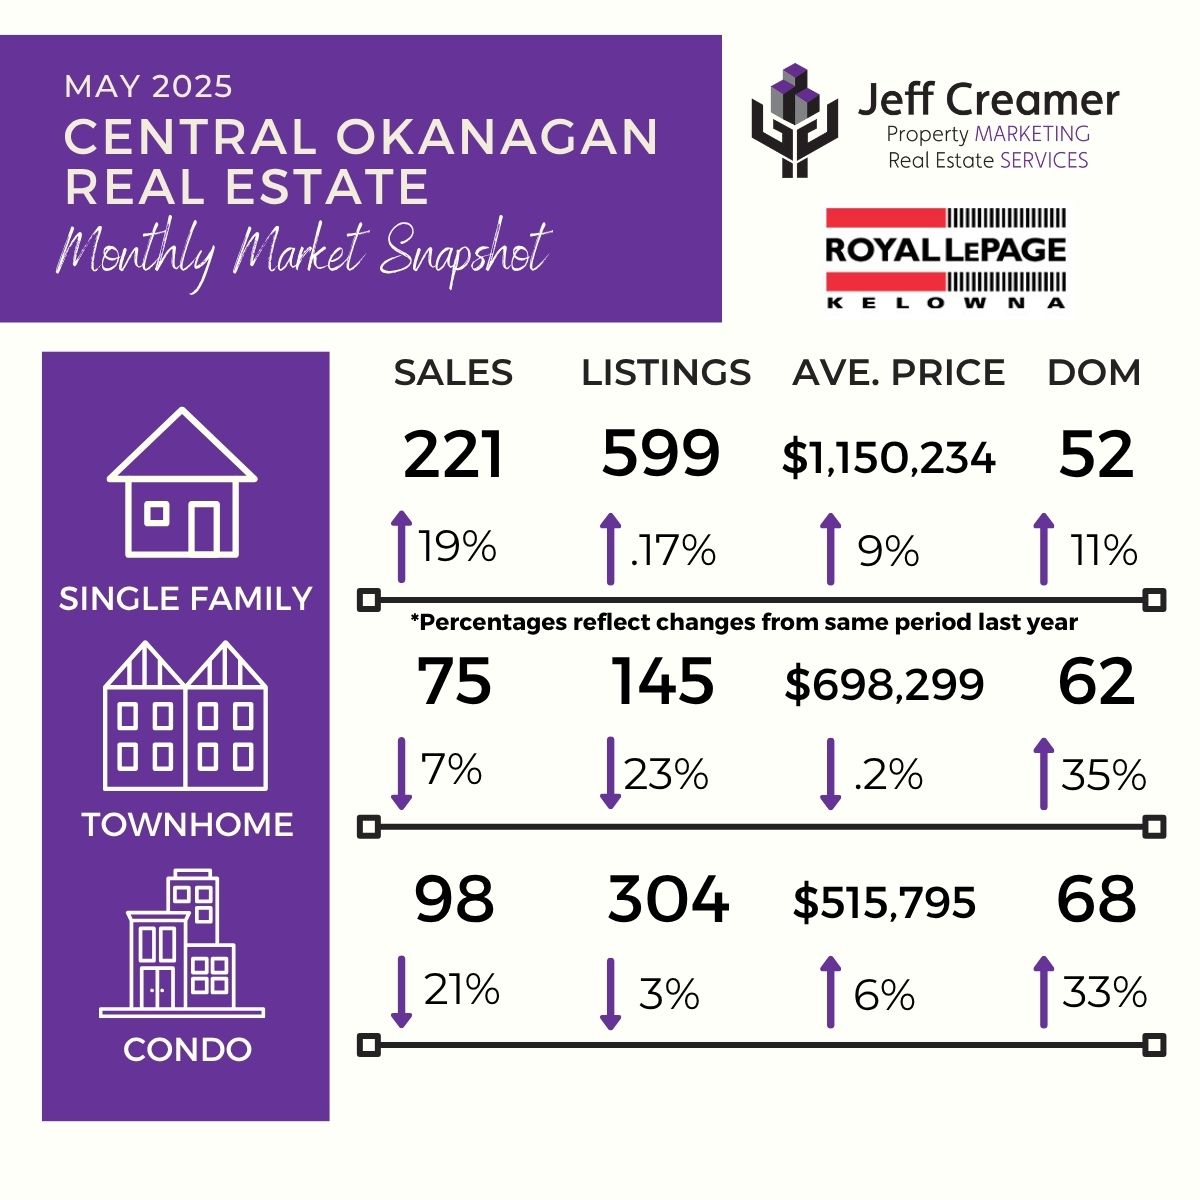
Central Okanagan / Kelowna Real Estate Market Statistics Snapshot: May 2025Kelowna Real Estate Market Update – May 2025
Central Okanagan Housing Trends and Statistics

Looking for the latest updates on the Kelowna housing market? This May 2025 market report highlights key real estate trends in the Central Okanagan, including changes in home sales, average prices, inventory levels, and days on market for single-family homes, townhomes, and condos.

Kelowna Single-Family Home Market – May 2025

  • Sales: Sales of single-family homes jumped 19% year-over-year, with 221 homes sold in May 2025—up from 186 in May 2024.
  • New Listings: Listings rose slightly by 0.17%, reaching 599 new homes listed in May 2025.
  • Average Price: The average price for a detached home increased 9% to $1,150,234, compared to $1,057,549 in May 2024.
  • Days on Market: Homes took longer to sell, averaging 52 days on the market—an 11% increase from 47 days last year.

Kelowna Townhome Market – May 2025

  • Sales: Townhome sales declined 7%, with 75 units sold in May 2025 versus 81 in May 2024.
  • New Listings: Inventory dropped significantly, down 23% year-over-year to 145 new listings.
  • Average Price: Prices dipped slightly by 0.2%, with the average townhome selling for $698,299 (down from $700,205).
  • Days on Market: Townhomes took 35% longer to sell, averaging 62 days on market compared to 46 days a year ago.

Kelowna Condo Market – May 2025

  • Sales: Condo sales fell 21% year-over-year, with 98 units sold—down from 124 in May 2024.
  • New Listings: The number of new condo listings decreased by 3%, totaling 304 for the month.
  • Average Price: The average condo price climbed 6% to $515,795, up from $484,660 last May.
  • Days on Market: Condos spent more time on the market—averaging 68 days, a 33% increase from 51 days in May 2024.

Thinking of Buying or Selling in Kelowna?

Whether you're planning to buy your first home or sell your current property, get expert advice tailored to the Kelowna real estate market. Contact Jeff Creamer at Royal LePage Kelowna for professional support backed by local market expertise.

  • Call: 250-575-7112
  • Email: jeff@shopkelownahomes.com

View April 2025 Central Okanagan / Kelowna Real Estate Market Statistics

Source: Association of Interior Realtors

Posted in Market Reports
May 6, 2025

Central Okanagan / Kelowna Real Estate Market Statistics: April 2025

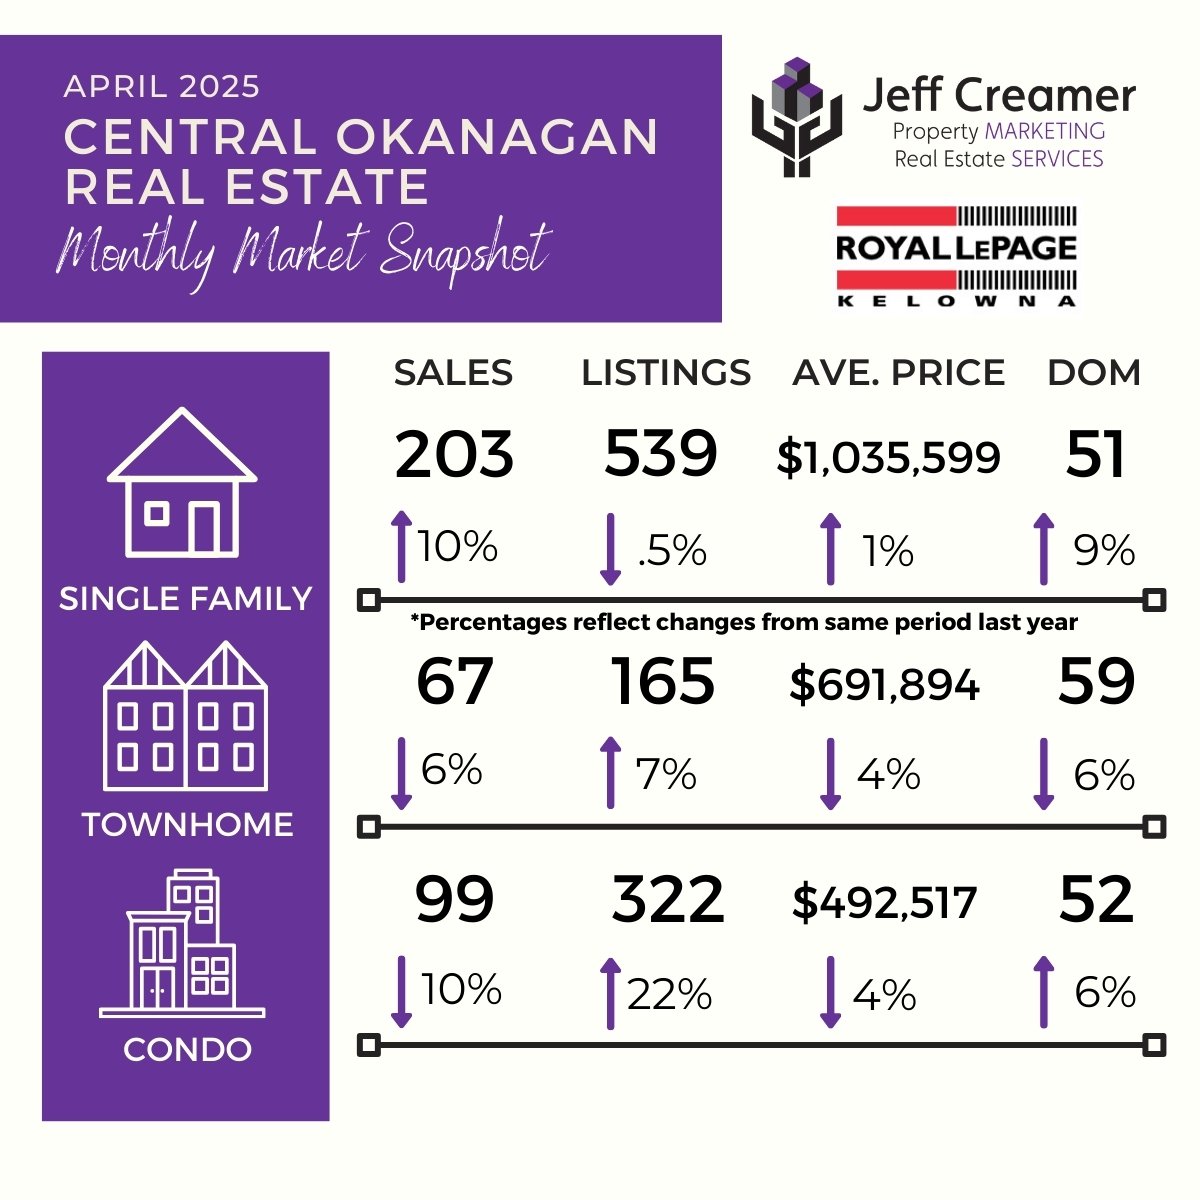
Central Okanagan / Kelowna Real Estate Market Statistics Snapshot: April 2025Kelowna & Central Okanagan Real Estate Market Report – April 2025
Explore the latest trends in the Kelowna real estate market for April 2025. This monthly market update provides a snapshot of sales activity, home prices, inventory changes, and average days on market (DOM) for single-family homes, townhouses, and condos in the Central Okanagan region.

Kelowna Single-Family Home Stats – April 2025

  • Home Sales: Sales of single-family homes rose 10% year-over-year, with 203 properties sold in April 2025 compared to 185 in April 2024.
  • New Listings: There were 539 new listings, representing a slight decrease of 0.5% from 542 in April 2024.
  • Average Sale Price: The average price for a detached home reached $1,035,599 in April 2025, up from $1,025,308 the previous year.
  • Days on Market (DOM): Homes sold faster this year, averaging 51 days on market—a 9% improvement from 47 days in April 2024.

Kelowna Townhouse Market Overview – April 2025

  • Townhome Sales: Sales dipped 6% year-over-year, with 67 units sold in April 2025 versus 71 in April 2024.
  • New Listings: A 7% increase in inventory was recorded, with 165 new townhome listings compared to 154 last year.
  • Average Price: Townhome prices averaged $691,894 in April 2025, reflecting a 4% decline from $717,629 in April 2024.
  • Days on Market (DOM): Townhomes moved 6% quicker, spending an average of 59 days on market compared to 63 days last April.

Kelowna Condo Market Trends – April 2025

  • Condo Sales: Sales declined 10%, with 99 condo units sold in April 2025, down from 110 the year prior.
  • New Listings: Inventory rose significantly by 22%, with 322 new listings compared to 264 in April 2024.
  • Average Price: The average condo price dropped 4% to $492,517 in April 2025, down from $511,379 a year earlier.
  • Days on Market (DOM): Condos took 6% longer to sell, averaging 52 days on market compared to 48 days in April 2024.

Looking to Buy or Sell Real Estate in Kelowna?

Whether you're thinking about purchasing or selling property in Kelowna, connect with Jeff Creamer at Royal LePage Kelowna for professional support and market insight tailored to your goals in the Central Okanagan housing market.

  • Call: 250-575-7112
  • Email: jeff@shopkelownahomes.com

Check out March 2025 Central Okanagan / Kelowna Real Estate Market Statistics

Source: Association of Interior Realtors

Posted in Market Reports
April 8, 2025

Central Okanagan / Kelowna Real Estate Market Statistics: March 2025

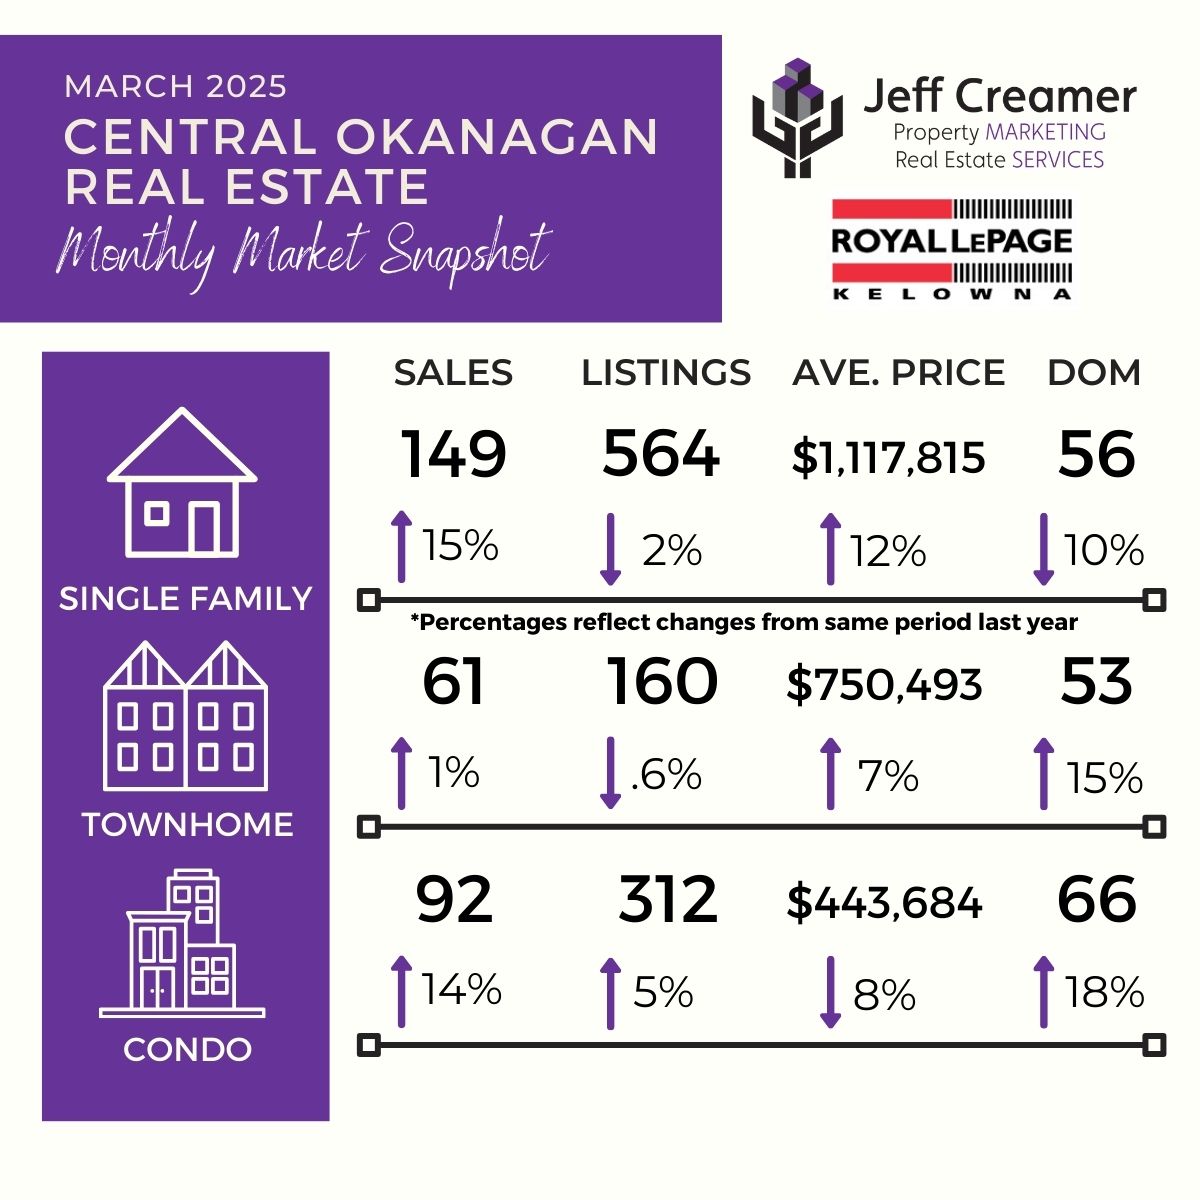
Central Okanagan / Kelowna Real Estate Market Statistics Snapshot: March 2025Kelowna Real Estate Market Report – March 2025 | Central Okanagan Housing Trends
Explore the latest Kelowna real estate market update for March 2025. This monthly report highlights key housing trends across the Central Okanagan, including updated statistics on home sales, property prices, new listings, and days on market for single-family homes, townhouses, and condominiums.

Kelowna Single-Family Home Market – March 2025

  • Home Sales: Sales of single-family homes rose 15% year-over-year, with 149 homes sold in March 2025, compared to 130 in March 2024.
  • New Listings: Inventory dipped slightly, with 564 new listings—down 2% from 574 the year prior.
  • Average Price: The average home price increased to $1,117,815, up from $994,594 in March 2024.
  • Days on Market: Homes sold faster, averaging 56 days on the market—a 10% improvement from 62 days last year.

Kelowna Townhome Market – March 2025

  • Townhome Sales: A modest 1% increase in townhome sales, with 61 units sold this March, up from 60 in March 2024.
  • New Listings: Listings held steady, with 160 new townhomes listed, just one fewer than the 161 listings seen in March 2024.
  • Average Price: Townhome prices rose 7% to $750,493, up from $702,815 in March 2024.
  • Days on Market: Townhomes spent 53 days on the market—15% longer than the 46-day average last March.

Kelowna Condo Market – March 2025

  • Condo Sales: Condo sales jumped 14%, with 92 units sold in March 2025, compared to 81 last year.
  • New Listings: Inventory rose 5%, with 312 new condo listings, up from 296 in March 2024.
  • Average Price: The average condo price declined 8% to $443,684, down from $480,682 the previous year.
  • Days on Market: Condos took longer to sell, averaging 66 days on the market—a rise of 18% from 56 days last March.

Ready to Buy or Sell in the Kelowna Real Estate Market?

If you're planning to buy or sell real estate in Kelowna or the Central Okanagan, connect with Jeff Creamer at Royal LePage Kelowna. Get expert insights and personalized support in today's evolving market.

  • Call: 250-575-7112
  • Email: jeff@shopkelownahomes.com

Check out February 2025 Central Okanagan / Kelowna Real Estate Market Statistics

Source: Association of Interior Realtors

Posted in Market Reports
March 11, 2025

Central Okanagan / Kelowna Real Estate Market Statistics: February 2025

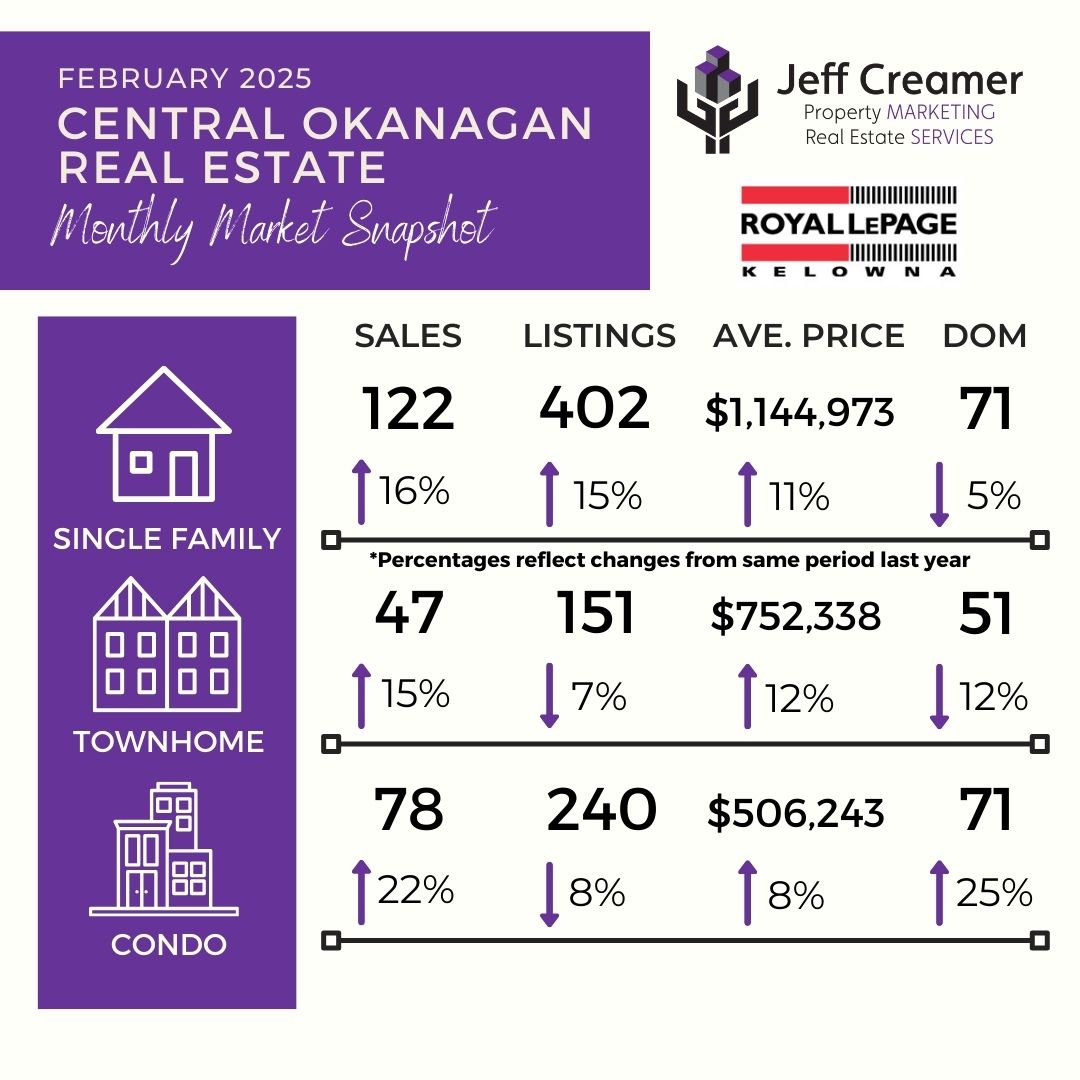
Central Okanagan / Kelowna Real Estate Market Statistics Snapshot: February 2025Central Okanagan / Kelowna Real Estate Market Update – February 2025
Get the latest insights into Kelowna's real estate market for February 2025. This report covers key trends in the housing market, including sales data, pricing changes, and inventory levels for single-family homes, townhomes, and condos in the Central Okanagan.

Kelowna Single-Family Home Market – February 2025

  • Sales: Single-family home sales increased by 16% year-over-year, with 122 homes sold in February 2025, up from 105 in February 2024.
  • New Listings: The number of new listings rose by 15%, reaching 402 in February 2025, compared to 350 the previous year.
  • Average Price: Home prices climbed, with the average price at $1,144,973 in February 2025, up from $1,035,940 in February 2024.
  • Days on Market (DOM): Homes sold 5% faster, averaging 71 days on the market compared to 75 days in February 2024.

Kelowna Townhome Market – February 2025

  • Sales: Townhome sales saw a 15% increase, with 47 units sold in February 2025, up from 41 in February 2024.
  • New Listings: Inventory declined by 7%, with 151 new townhome listings in February 2025, compared to 163 in February 2024.
  • Average Price: The average townhome price rose 12% to $752,338 in February 2025, up from $673,241 the year before.
  • Days on Market (DOM): Townhomes sold 12% faster, averaging 51 days on the market compared to 58 days in February 2024.

Kelowna Condo Market – February 2025

  • Sales: Condo sales rose 22%, with 78 units sold in February 2025, up from 64 in February 2024.
  • New Listings: New condo listings decreased by 8%, with 240 new listings in February 2025, down from 262 in February 2024.
  • Average Price: Condo prices increased by 8%, reaching an average of $506,243 in February 2025, compared to $467,664 in February 2024.
  • Days on Market (DOM): The average time to sell a condo increased by 25%, with units spending 71 days on the market in February 2025, compared to 57 days the previous year.

Thinking of Buying or Selling in Kelowna?

If you're considering buying or selling a home in Kelowna, reach out to Jeff Creamer at Royal LePage Kelowna for expert guidance in the Central Okanagan real estate market.

  • Call: 250-575-7112
  • Email: jeff@shopkelownahomes.com

Check out Last Month's Central Okanagan / Kelowna Real Estate Market Statistics

Source: Association of Interior Realtors

Posted in Market Reports
Feb. 4, 2025

Central Okanagan / Kelowna Real Estate Market Statistics: January 2025

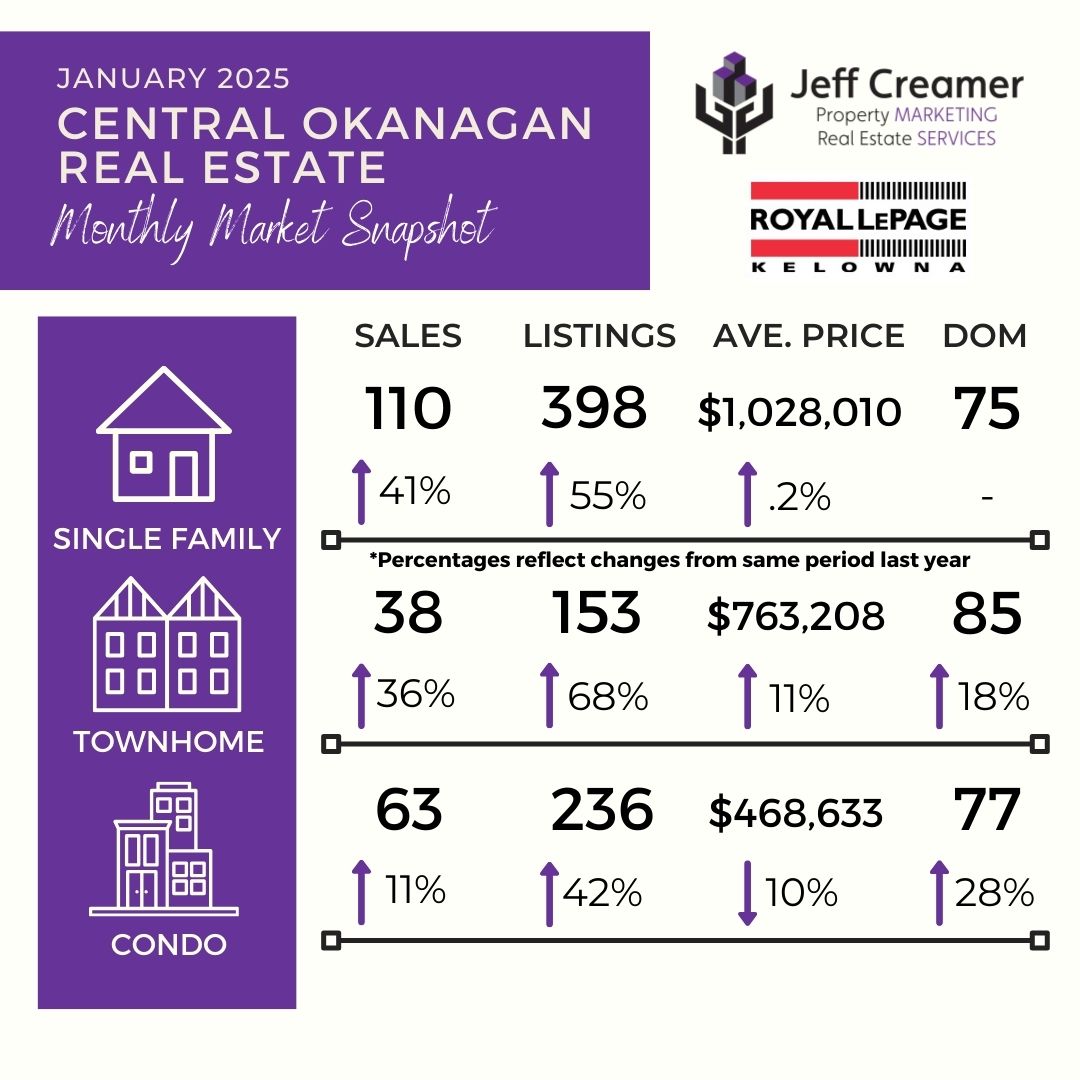
Central Okanagan / Kelowna Real Estate Market Statistics Snapshot: January 2025Central Okanagan / Kelowna Real Estate Market Update – January 2025

Discover the latest Kelowna real estate market trends for January 2025. This report covers key insights into single-family homes, townhomes, and condos, including sales figures, pricing trends, and market activity in the Central Okanagan housing market.

Kelowna Single-Family Home Market – January 2025

  • Sales: Single-family home sales rose 41% year-over-year, with 110 homes sold in January 2025, up from 78 in January 2024.
  • New Listings: The market saw a 55% increase in new listings, reaching 398 homes in January 2025, compared to 257 in January 2024.
  • Average Price: Prices remained stable, with an average home price of $1,028,010 in January 2025 versus $1,026,519 in January 2024.
  • Days on Market (DOM): The average time to sell remained unchanged at 75 days for both January 2025 and January 2024.

Kelowna Townhome Market – January 2025

  • Sales: Townhome sales grew 36% year-over-year, with 38 units sold in January 2025 compared to 28 in January 2024.
  • New Listings: Inventory surged 68%, with 153 new townhome listings in January 2025, up from 91 in January 2024.
  • Average Price: Townhome prices rose 11%, with the average price hitting $763,208 in January 2025 compared to $687,136 the previous year.
  • Days on Market (DOM): Townhomes took 18% longer to sell, with an average of 85 days on the market, compared to 72 days in January 2024.

Kelowna Condo Market – January 2025

  • Sales: Condo sales saw an 11% increase, with 63 units sold in January 2025, compared to 57 in January 2024.
  • New Listings: The number of new condo listings jumped 42%, reaching 236 new listings in January 2025, compared to 166 in January 2024.
  • Average Price: Condo prices declined 10%, with the average condo price at $468,633 in January 2025, down from $517,624 in January 2024.
  • Days on Market (DOM): The average time to sell a condo increased by 28%, with units spending 77 days on the market in January 2025, compared to 60 days in January 2024.

Looking to Buy or Sell in Kelowna?

If you're considering buying or selling a home in Kelowna, reach out to Jeff Creamer at Royal LePage Kelowna for expert guidance in the Central Okanagan real estate market.

  • Call: 250-575-7112
  • Email: jeff@shopkelownahomes.com

Check out Last Month's Central Okanagan / Kelowna Real Estate Market Statistics

Source: Association of Interior Realtors

Posted in Market Reports
Jan. 6, 2025

Central Okanagan / Kelowna Real Estate Market Statistics: December 2024

Central Okanagan / Kelowna Real Estate Market Statistics Snapshot: December 2024Central Okanagan / Kelowna Real Estate Market Update: December 2024

Stay updated on the Central Okanagan / Kelowna real estate market trends for December 2024. This report provides key data on single-family homes, townhomes, and condos, including a year-over-year comparison of sales figures, average prices, and market activity.

Single-Family Homes

  • Sales: Single-family home sales increased by 42% year-over-year, with 116 homes sold in December 2024 compared to 82 in December 2023.
  • New Listings: A 31% rise in new listings brought the total to 160 homes in December 2024, up from 122 during the same period last year.
  • Average Price: Prices climbed by 7%, with an average price of $1,076,544 in December 2024 compared to $1,005,010 in December 2023.
  • Days on Market (DOM): Homes took 24% longer to sell, averaging 77 days compared to 62 days in December 2023.

Townhomes

  • Sales: Townhome sales rose by 38%, with 40 units sold in December 2024 compared to 29 in December 2023.
  • New Listings: Listings decreased by 19%, with 50 townhomes added to the market in December 2024 compared to 105 in December 2023.
  • Average Price: Prices dropped by 1%, with the average townhome price recorded at $688,309 in December 2024 versus $697,324 a year ago.
  • Days on Market (DOM): The time on the market increased by 37%, with townhomes averaging 71 days compared to 52 days the previous year.

Condos

  • Sales: Condo sales grew by 53% year-over-year, with 69 units sold in December 2024 compared to 45 in December 2023.
  • New Listings: New condo listings dropped by 6%, with 83 condos added in December 2024 compared to 88 in December 2023.
  • Average Price: Condo prices declined by 6%, with an average price of $457,519 in December 2024 versus $484,254 a year ago.
  • Days on Market (DOM): Condos took 23% longer to sell, averaging 65 days compared to 53 days in December 2023.

Contact a Kelowna Realtor

Looking for insights into the Central Okanagan / Kelowna housing market? Contact Jeff Creamer at Royal LePage Kelowna for assistance.

  • Call: 250-575-7112
  • Email: jeff@shopkelownahomes.com

Check out Last Month's Central Okanagan / Kelowna Real Estate Market Statistics

Source: Association of Interior Realtors

Posted in Market Reports
Dec. 5, 2024

Central Okanagan / Kelowna Real Estate Market Statistics: November 2024

Central Okanagan / Kelowna Real Estate Market Statistics Snapshot: November 2024Central Okanagan / Kelowna Real Estate Market Update: November 2024

Discover the latest trends in the Central Okanagan / Kelowna real estate market for November 2024. This update highlights key data for single-family homes, townhomes, and condos, offering a snapshot of market activity.

Single-Family Homes

  • Sales: Sales of single-family homes in increased by 15% compared to November 2023, with 123 homes sold versus 107 last year.
  • New Listings: A 5% decline in new listings brought the total to 244 in November 2024, down from 256 in November 2023.
  • Average Price: Prices of single-family homes rose slightly by 1%, reaching $1,064,566 in November 2024, compared to $1,055,841 a year ago.
  • Days on Market (DOM): Homes took 21% longer to sell, averaging 70 days in November 2024 compared to 58 days in November 2023.

Townhomes

  • Sales: Townhome sales saw a year-over-year increase of 47%, with 50 units sold in November 2024 versus 34 in November 2023.
  • New Listings: New listings rose slightly by 2%, totaling 107 in November 2024 compared to 105 in the prior year.
  • Average Price: Prices decreased by 1%, with an average price of $667,860 in November 2024 compared to $673,540 in November 2023.
  • Days on Market (DOM): Townhomes stayed on the market 18% longer, averaging 60 days in November 2024 versus 51 days in November 2023.

Condos

  • Sales: Condo sales surged by 58% year-over-year, with 98 units sold in November 2024, up from 62 in November 2023.
  • New Listings: A 12% drop in new listings resulted in 183 new condos on the market in November 2024, down from 208 in November 2023.
  • Average Price: The average price increased by 15%, reaching $502,373 in November 2024 compared to $438,043 in November 2023.
  • Days on Market (DOM): Condos stayed on the market 15% longer, averaging 63 days in November 2024 versus 53 days in November 2023.

For expert advice or additional details about the Central Okanagan / Kelowna real estate market, reach out to Jeff Creamer at Royal LePage Kelowna. Call 250-575-7112 or email jeff@shopkelownahomes.com today!

Check out Last Month's Central Okanagan / Kelowna Real Estate Market Statistics

Source: Association of Interior Realtors

Posted in Market Reports